Sometimes a chat answer isn’t enough — you need a deliverable. Intelligence Reports turn your dashboard data into structured, citable documents you can circulate to stakeholders, attach to tickets, or file as a point-in-time record. Every report is generated in one chat prompt, stored on the dashboard, and ready to export.
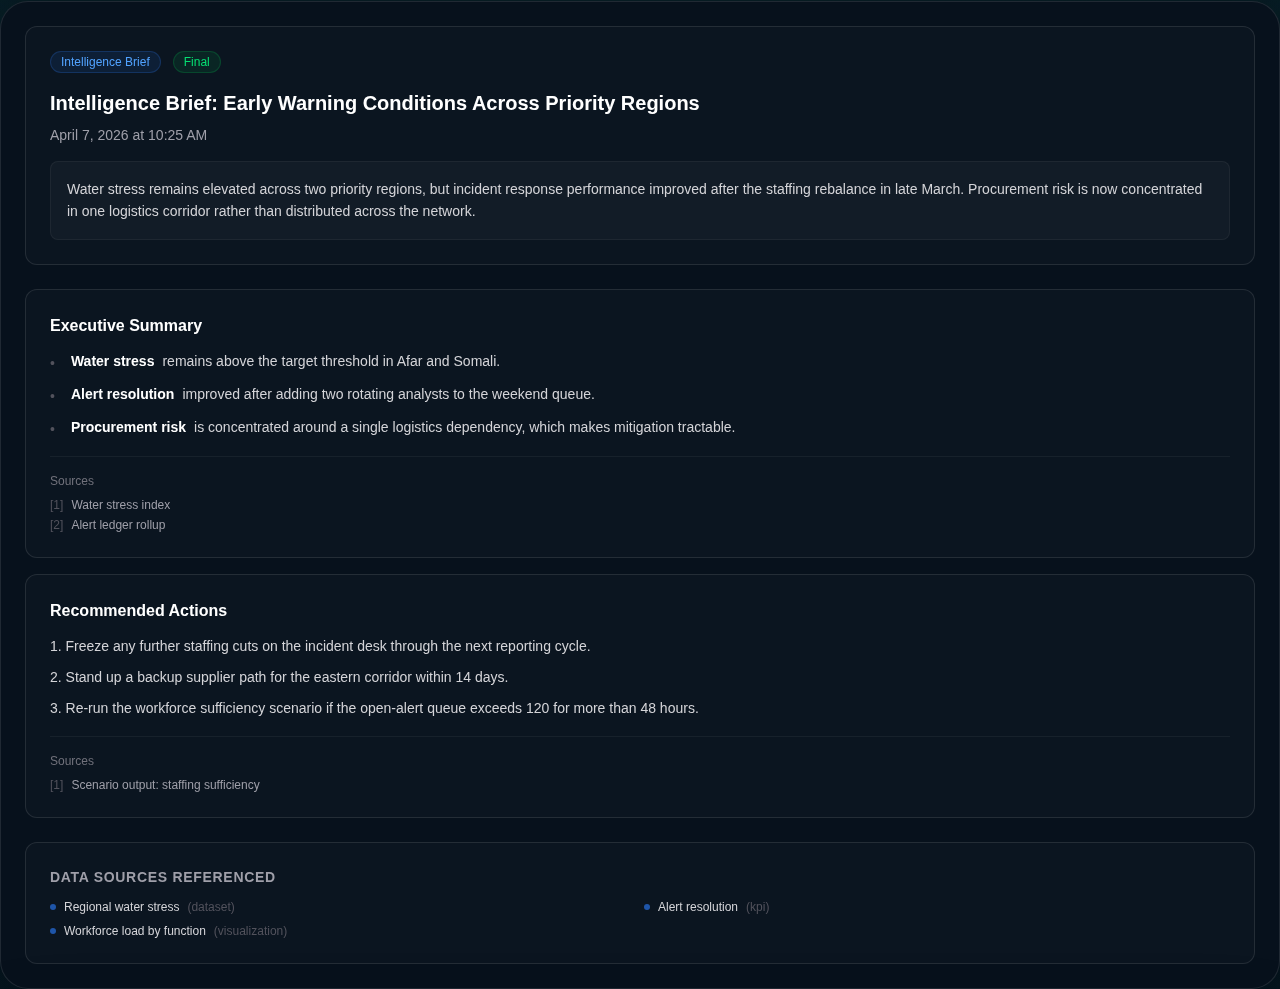
A stable example report rendered from the same report viewer component used in Delphi.
Report types
Delphi generates four standard report types plus a custom mode, each tuned to a different decision. Choose the one that matches what your reader needs to do next.
- Intelligence brief — a general analytical summary of the current state. Use this when you want a well-rounded read on everything the dashboard knows.
- Trend analysis — time-series focused. Good for “what has changed in the last quarter” or “where is this metric headed”.
- Risk assessment — threat and vulnerability framing. Surfaces what could go wrong, how likely it is, and what you can do about it.
- Status update — periodic check-in format for recurring stakeholder communications.
- Custom — you describe the structure in chat and Delphi follows your lead.
Reports anchor on your actual data sources — datasets, connectors, and KPIs. Pointing a report at specific KPIs is the best way to keep the numbers consistent with the rest of your dashboard.
Generate a report from chat
Reports are produced through the chat interface. Just ask — Delphi will pick the right report type, pull the relevant sources, and save the result.
Write an intelligence brief for this dashboard focused on the last 30 days.
Generate a risk assessment covering our top three KPIs and flag anything trending in the wrong direction.
You can be as specific as you like. Name a dataset, scope to a time window, point at particular KPIs, or describe the audience (“this is going to the board, keep it to five sections”). If you don’t specify a type, Delphi defaults to an intelligence brief. Generation takes a few seconds and Delphi replies with the report title and a link to open it.
A quick note: asking Delphi to “summarize my documents” will read them directly in chat. Reports are for when you explicitly want a written deliverable — use phrases like “write a report”, “generate a brief”, or “create an analysis”.
Reading a report
Every report you generate lands on the Reports tab of the dashboard. Each entry shows the type, status (draft, final, or archived), the date it was generated, and the number of sections and sources it draws on. Click a report to expand it inline.
Inside the report you’ll find an executive summary up top, followed by the analytical sections Delphi produced. Each section is markdown-formatted with headings, bullets, and emphasis. Below the body, a Data Sources Referenced block lists every dataset, connector, KPI, and visualization the report cites — so readers can trace any claim back to its origin. Sections may also include inline citations with links out to external sources where relevant.
Reports are versioned snapshots. They reflect the state of your data at the moment of generation, which makes them useful as audit artifacts and historical records even after the underlying numbers change.
Exporting and sharing
Reports are exportable to PDF for circulation outside Delphi — attach them to emails, upload them to a document store, or drop them into a ticket. The exported document preserves the title, executive summary, section structure, and the full list of referenced sources.
To share a report with other people who have dashboard access, just point them at the Reports tab — everyone with the right permission scope sees the same list. For broader distribution, generate the PDF and send it through your normal channels. Reports sit alongside your live KPIs and visualizations, so a reader who wants the current numbers can jump from the report back into the dashboard itself.